mermaidJStutorial
# Mermaid.js: Create Beautiful Diagrams with Simple Markdown-Like Syntax
Introduction
Mermaid.js is basically a JavaScript tool that lets you create diagrams using text - kinda like how Markdown works for formatting. Instead of dragging boxes around and getting frustrated when they won’t align properly, you just write some simple text, and boom - you get a professional-looking diagram.
What I really love about it is how it bridges the gap between different teams. Developers can use it, but so can project managers and writers. Since everything’s just text, you can keep your diagrams in version control alongside your code. Super handy for tech documentation!
Installation & Setup
Getting Mermaid up and running isn’t complicated at all. There’s a few different ways to do it depending on what you need.
Option 1: CDN Integration (The Easy Way)
Just add this script tag to your HTML file:
<script src="https://cdn.jsdelivr.net/npm/mermaid/dist/mermaid.min.js"></script>
<script>
  mermaid.initialize({ startOnLoad: true });
</script>
Then create your diagram with a div that has the “mermaid” class:
<div class="mermaid">
  graph TD;
      A-->B;
      A-->C;
      B-->D;
      C-->D;
</div>
Option 2: NPM Installation (For JavaScript Projects)
If your working with Node.js or using bundlers:
npm install mermaid
Then import it and initialize in your JS file:
import mermaid from 'mermaid';
mermaid.initialize({ startOnLoad: true });
Option 3: Mermaid CLI (For Making Static Images)
Need to generate PNG files? Try this:
npm install -g @mermaid-js/mermaid-cli
And then you can use it like:
mmdc -i input.mmd -o output.png
Key Features & Explanation
Mermaid can handle quite a few diagram types - more than I initially expected!
- Flowcharts: Perfect for showing processes or workflows
- Sequence Diagrams: Great for showing how different parts of a system talk to each other
- Gantt Charts: Super useful for project planning and schedules
- Class Diagrams: If you’re into object-oriented programming, these are handy
- State Diagrams: For showing how states change in a system
- Entity Relationship Diagrams: Really useful for database design
- Pie Charts: Simple but effective for showing proportions
- User Journey Maps: Track how users move through your product or service
You just describe what you want, and Mermaid figures out how to display it. This means you can focus on what’s important - the content - not fiddling with pixels and alignment for hours!
Code Examples
Here are some diagrams that are commonly used:
Flowchart Example
graph TD
    A[Start] --> B{Is it working?}
    B -->|Yes| C[Great!]
    B -->|No| D[Debug]
    D --> B
This makes a simple flowchart with decision points. The syntax is pretty intuitive once you get used to it:
graph TDmeans “make a top-down graph”- The letters (A, B, C, D) are just labels for the nodes
- Arrows connect everything with the
-->syntax - You can style nodes with brackets -
[]gives you rectangles and{}makes diamonds
Sequence Diagram Example
sequenceDiagram
    participant Browser
    participant Server
    Browser->>Server: GET /api/data
    Server->>Database: SELECT * FROM data
    Database-->>Server: Return results
    Server-->>Browser: Send JSON response
This shows how a browser, server, and database interact:
- Start with
sequenceDiagramto tell Mermaid what you’re making - List out the participants
- The arrows show messages being passed
- Everything flows from top to bottom, so the sequence is really clear
Gantt Chart Example
gantt
    title Development Roadmap
    dateFormat  YYYY-MM-DD
    section Planning
    Requirements gathering :done, a1, 2023-01-01, 10d
    System design          :active, a2, after a1, 15d
    section Implementation
    Frontend development   :b1, after a2, 20d
    Backend development    :b2, after a2, 25d
    section Testing
    Integration testing    :c1, after b1, 5d
They show:
- Project timeline broken into sections
- What depends on what (this can’t start until that finishes)
- Current status of tasks
- How long things should take
Class Diagram Example
classDiagram
    class Animal {
        +String name
        +int age
        +makeSound() void
    }
    class Dog {
        +fetch() void
    }
    class Cat {
        +climb() void
    }
    Animal <|-- Dog
    Animal <|-- Cat
This is really handy for showing:
- Classes with their properties and methods
- How classes inherit from each other
- The overall structure of your object model
Result of the Diagrams
Here’s what these diagrams actually look like when rendered:
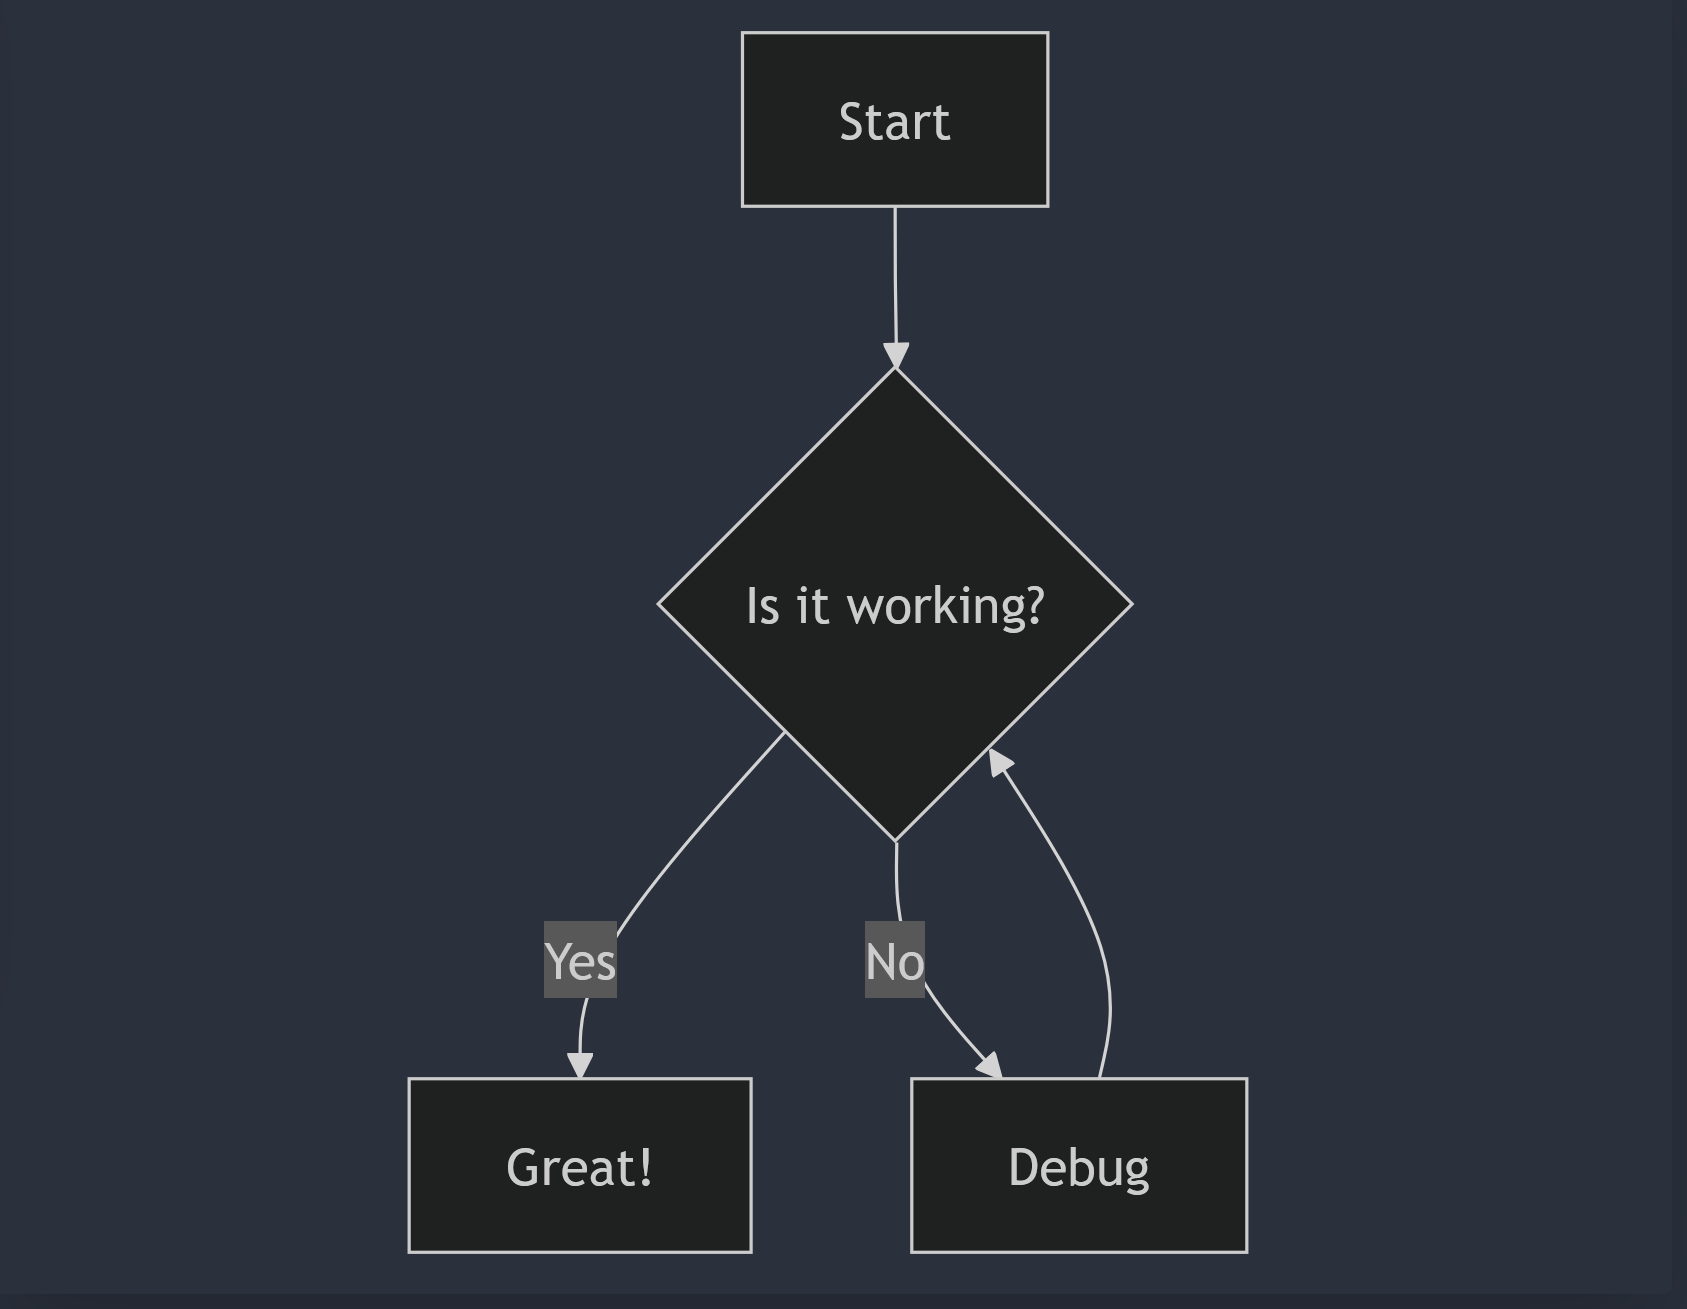
A basic flowchart with decision logic
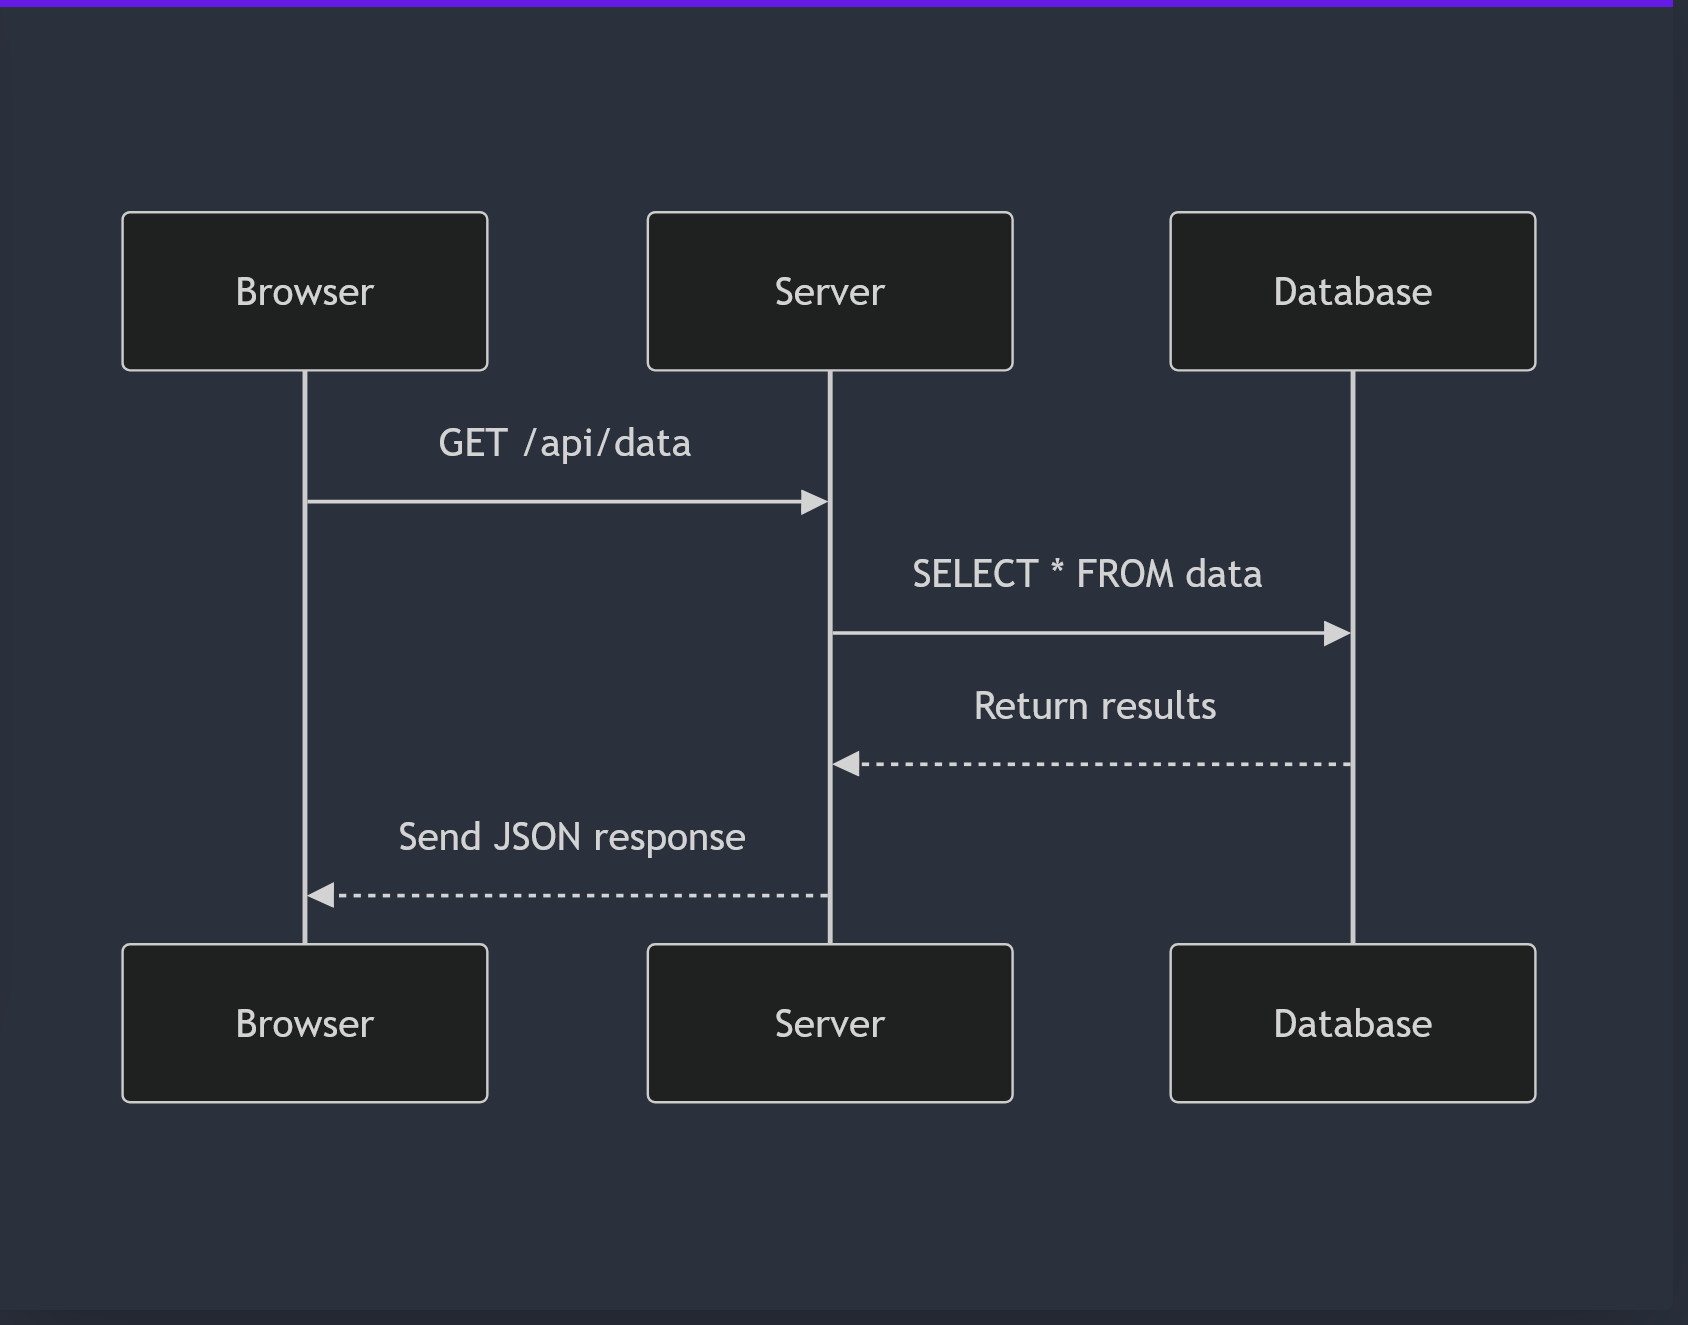
Sequence diagram showing how systems interact - helpful for API docs
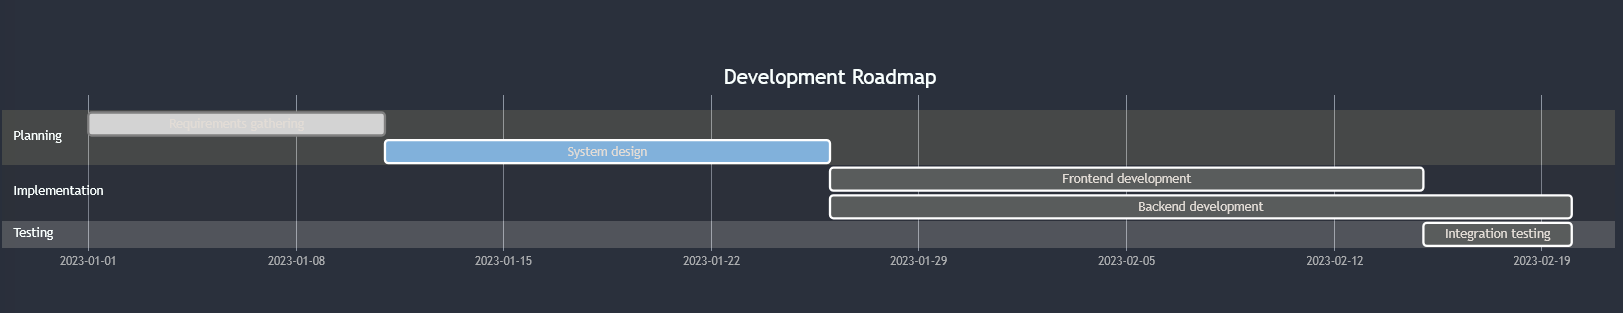
Gantt chart for project planning
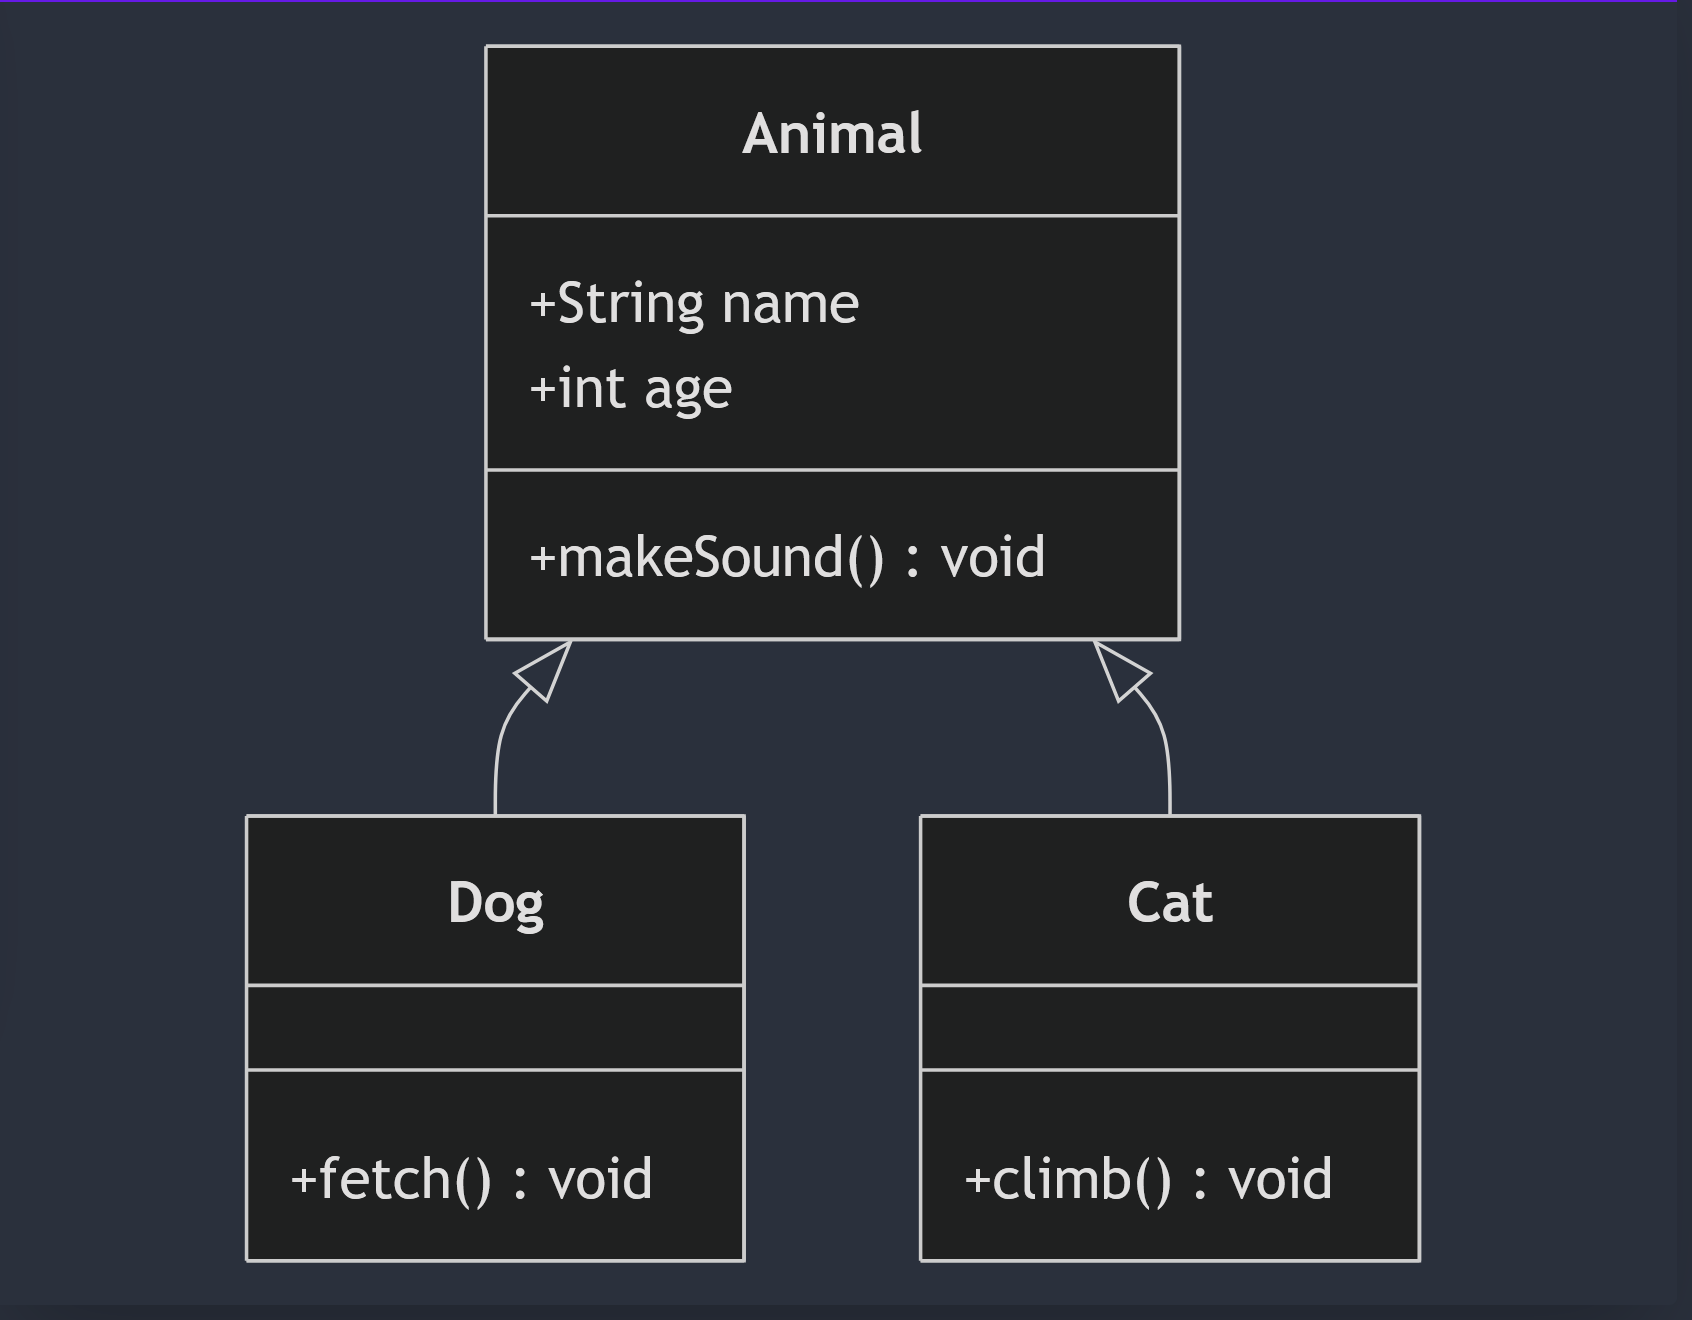
Class diagram showing inheritance - great for OOP design discussions
Use Cases
Here are some common use cases for mermaid.js:
Software Development
- Architecture Docs: Updating architecture documentation
- API Flows: Showing API flows and endpoint connections
- Database Visualization: ER diagrams straight in the docs = less confusion
Project Management
- Task Dependencies: Gantt charts that update as easily as changing a text file
- Process Workflows: Diagramming helps make the workflows clean to look at and follow
- System States: Tracking application states with state diagrams
Education & Training
- Explaining Concepts: Breaking down complex ideas is way easier with a visual
- Step-by-Step Guides: Adding flowcharts to show procedures
- Concept Maps: Showing how different ideas connect
Technical Writing
- Better Documentation: Adding visuals to docs without the pain of separate diagram tools
- Onboarding Materials: New team members can see workflows immediately
- Troubleshooting Guides: Decision trees for solving common problems
Conclusion
Mermaid.js has completely changed how I handle diagrams in my technical docs. It solves so many headaches:
- Version control actually works now - the diagrams are just text files!
- Updating is so much easier - just change the text, there is no need to find the original diagram file
- Accessibility is better because there’s a text representation
- It fits perfectly with Markdown documentation
If you write technical docs, work in development, or need to plan projects, you should definitely give it a try. The learning curve isn’t steep at all, but what you can do with it is pretty impressive.
Whether you’re mapping out a complex system architecture, planning project timelines, or just trying to explain a process, Mermaid.js lets you create clear diagrams without leaving your text editor.
References & Further Reading
- Official Mermaid.js Docs - start here to learn more
- Mermaid.js on GitHub - check out the source code
- Mermaid Live Editor - this is super helpful for experimenting
- Using Mermaid with GitHub - GitHub supports Mermaid
- Integrations with Other Tools - works with lots of documentation systems